Introduction
Understanding CPU processor usage is important for overall system performance measurement. From Linux enthusiasts to system admins, knowing how to monitor CPU utilization in Linux from the command line is crucial.
This guide will walk you through several options to check Linux CPU usage.

Prerequisites
- A user account with sudo privileges.
- Access to a command line/terminal window.
- A package installer, like apt or dnf, usually included by default.
Note: Use one of 5 available commands in Linux to check memory usage.
How to Check CPU Usage from Linux Command Line
Linux provides a variety of tools for monitoring CPU activity. The following section explains how to use the top, mpstat, sar, and iostat commands to view and interpret CPU usage.
top Command to View Linux CPU Load
Open a terminal window and enter the following command:
topThe system responds by displaying a list of all the processes that are currently running. It also shows users, tasks, CPU load, and memory usage.
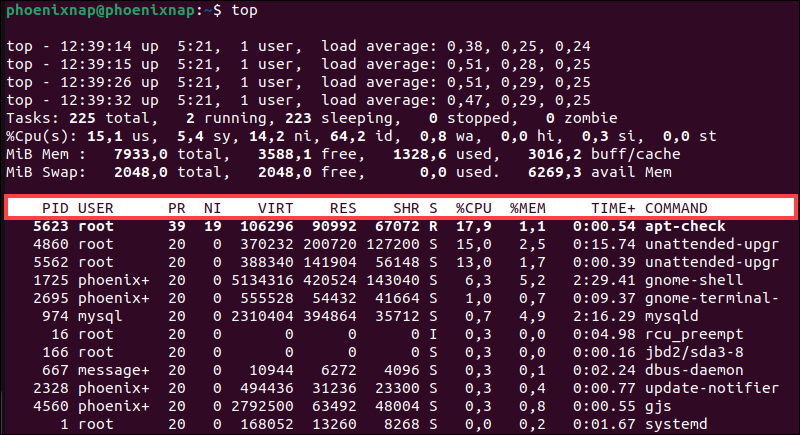
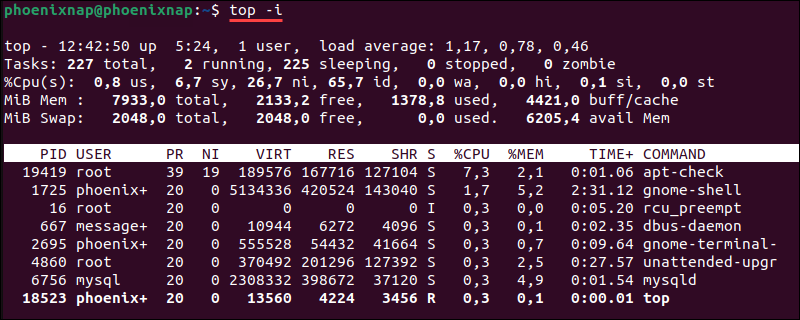
This list changes frequently as background tasks start and complete. To remedy this, enter top with the -i option:
top -iThe system hides all the idle processes, making it easier to sort through the list.
To quit the top function, press q.
Some other useful commands while top is running include:
M- sort task list by memory usage.P- sort task list by processor usage.N- sort task list by process ID.T- sort task list by run time.
To get assistance with top, press h while the tool running. Or, you can enter the following at a command line:
man topThis command displays the manual page for the top command.
mpstat Command to Display CPU Activity
Mpstat is part of a software bundle called sysstat. Most RHEL-based distributions include this software package.
For Debian and Ubuntu systems, install the sysstat package using the following command:
sudo apt install sysstatOnce the process finishes, enter the mpstat command:
mpstatThe system displays usage for each processor (or processor core).
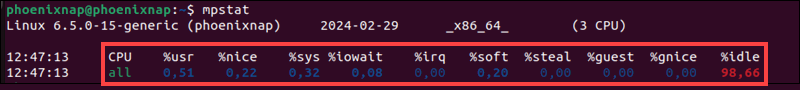
The first line is a set of column labels. The second line is the value for each column:
- %usr - % CPU usage at the user level.
- %nice - % CPU usage for user processes labeled "nice".
- %sys - % CPU usage at the system (Linux kernel) level.
- %iowait - % CPU usage idling waiting on a disk read/write.
- %irq - % CPU usage handling hardware interrupts.
- %soft - % CPU usage handling software interrupts.
- %steal - % CPU usage being forced to wait for a hypervisor handling other virtual processors.
- %guest - % CPU usage spent running a virtual processor.
- %idle - % CPU usage on idle time (no processes and not waiting on a disk read/write).
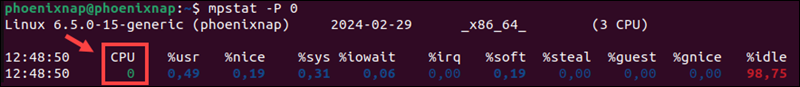
Users can add switches to the mpstat command. The -P switch lets you specify a single processor to report:
mpstat -P 0The system displays a report for the first processor (CPU 0).
Use the ALL option to show total statistics and list processes by individual CPU:
mpstat -P ALL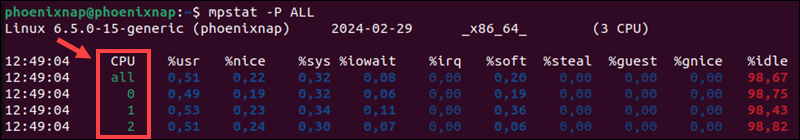
The mpstat command only takes a snapshot of CPU usage. To take a series of snapshots, use a number to indicate an interval and a second number to indicate the number of reports:
mpstat 5 7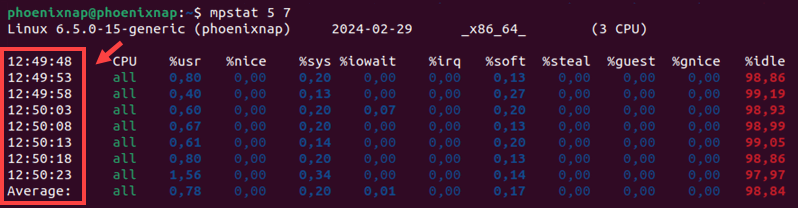
The command generates 7 snapshots, each 5 seconds apart, and calculates average values.
sar Command to Show CPU Utilization
The sar tool is a utility for managing system resources. It’s not limited strictly to CPU usage, but you can use the -u option to track CPU performance.
Enter the following command to direct sar to monitor CPU usage at set intervals:
sar -u 5The -u option displays CPU usage. The 5 indicates that it should display every 5 seconds.
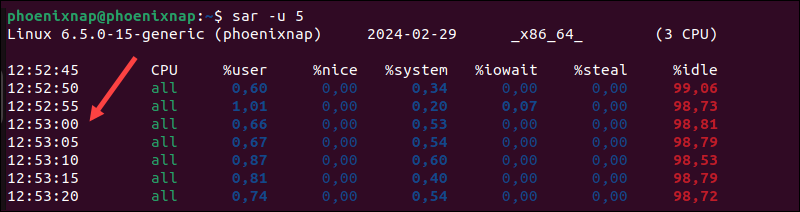
The command will run indefinitely. To cancel, press Ctrl+C.
iostat Command for Average Usage
In a terminal window, enter the following:
iostatThe system displays average CPU usage since the last boot. It also displays input/output load (disk read/write activity).
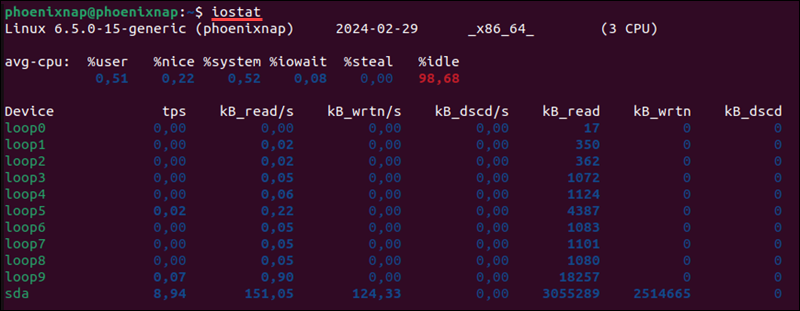
More information on iostat can be found on the Linux Manual pages.
Other Options to Monitor CPU Performance
Besides built-in commands for monitoring system performance, Linux also supports advanced third-party tools, like Nmon and GNOME System Monitor. These applications provide graphical interfaces that allow users to analyze CPU usage data and identify potential issues in a user-friendly environment.
Nmon Monitoring Tool
Nmon is a monitoring tool developed by Nigel Griffiths of IBM. To install Nmon on Ubuntu, enter the following command:
sudo apt install nmonFor RHEL-based systems, particularly those using versions 8 and above, you may need to enable the EPEL repository before proceeding with the installation:
sudo dnf install epel-releasesudo dnf install nmonLaunch nmon by typing:
nmonThis launches the utility and displays all the options. To view CPU usage, press the letter c.
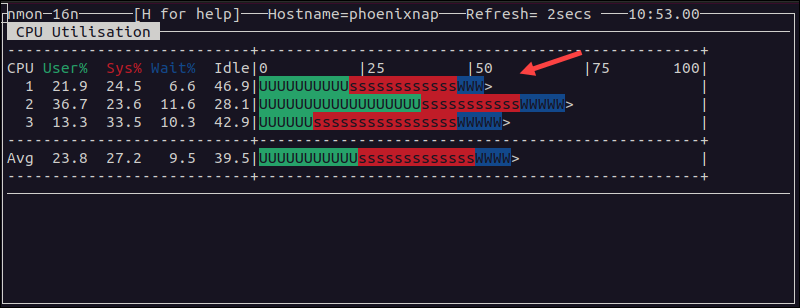
For a list of commands, press h. To quit, press q.
Graphical Utility Option
Many server systems don't waste processor cycles on a graphical user interface (GUI). However, you may have a lightweight GUI, or you may be using a client Linux system. Some versions, like Ubuntu, have a built-in graphical monitoring tool.
To launch Ubuntu's system monitor, enter the following in a terminal window:
gnome-system-monitorThis starts a task-manager-like application where you can monitor tasks and CPU usage.
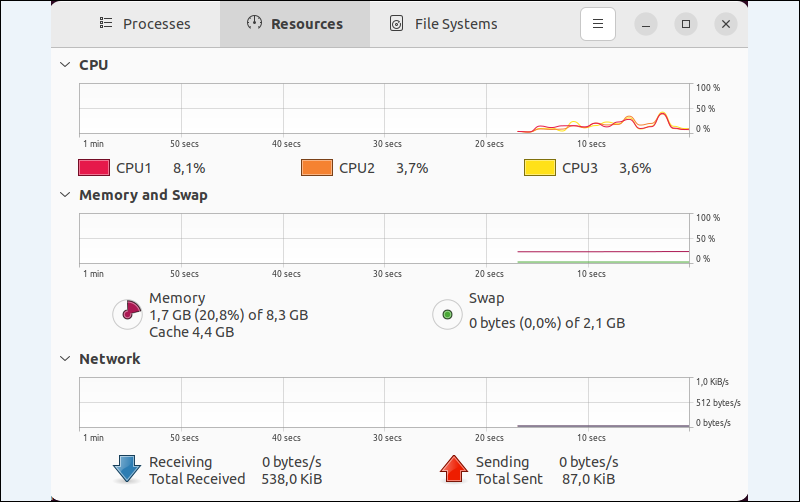
Typically, GUIs have a "task manager" or "system monitor" application. This can be used to monitor CPU usage in real time.
Conclusion
There are many different methods to check CPU usage in Linux.
This guide outlines the primary methods using built-in Linux tools or third-party applications. These commands will help you track processor usage and performance of your system, giving you greater control.